


Global Cross-Border Trade Rises, Indian Equities Grow in Favour
Tightened regulations might create stability conditions to draw in long-term investors


As of the end of 2024, cross-border assets under management (AUM) stood at a new high of €7 trillion, making up between 8% and 49% of AUM in every region, except North America. APAC is firmly the second-largest market — with Hong Kong, Singapore, and Taiwan serving as key hubs. While the Middle East and Latin America are smaller in scale, these markets demonstrate the growing reliance on UCITs products.
In a study commissioned by the Association of the Luxembourg Fund Industry (ALFI) from fintech data provider Broadridge, the cross-border market is observed to have registered a 35% growth in AUM in the half-decade relative to end of 2024.
Of the regions, Europe stood out as the region with the highest number of cross-border funds, with net AUM split nearly par with domestic holdings.

However, there are massive differences in market size: with an AUM of €37.8 trillion, North America is the biggest region in the world while Europe is a third of that size and Asia-Pacific is around half of Europe’s size. Latin America is 17% of Asia-Pacific’s size — and thus — only around 3% of North America’s AUM. Juxtaposing the two fact sets, cross-border funds account for 12% of all AUM held in funds across all major regions, not including money market funds, fund of funds and unallocated (i.e. ostensibly tactical) international funds. In absolute numbers, Europe-registered funds account for 89% of all “names” in these major regions.
On the institutional level, however, North America’s fund managers aren’t exclusively focused on their own region, as this representation might seem to indicate. When considering funds by managers’ provenance (i.e. where their parent company is headquartered), the U.S. accounts for over half of all AUM invested in cross-border funds.

About 92% of all AUM in cross-border funds are domiciled in tax- and regulation-friendly Luxembourg and Lichtenstein, while the Cayman Islands (located in North America) accounts for only 1%.

Cumulative inflows to Asia-Pacific and Europe are at 5-year highs, having grown by almost 200% and 250% relative to 2019 respectively:

Latin America and North America, meanwhile, have been stilling in favour for three years among growth- and diversification-seeking institutional investors.
Among cross-border asset types, equities have emerged as a strong contender in year-on-year inflows after both equities and bonds saw outflows during the “pandemic year” of 2021:

In 2024 alone, the United Kingdom was the biggest beneficiary of cross-border flows into Europe while Singapore was the biggest in Singapore.

Both countries are central to commerce value chains in their regions and prominently positioned for cross-border investments into their respective regions as well. Both these countries are prominent locations for investments into a regional powerhouse in Asia: India.
Foreign Interest in India
As per India’s deposits repository CDSL, long-term interest in Indian equities — denoted as “Assets Under Custody” (or “AUC”) — has remained resilient over the past five years.

Direct investments from the U.S. continue to account for nearly half of all investments made by Foreign Institutional Investors (FIIs) and Foreign Portfolio Investors (FPIs) while the Irish and Luxembourgian are estimated to represent cross-border funds from Europe as well as North America. All told, Europe for around a quarter of all Top 10 FPI/FII long-term activity.
Mauritius — which was absent in Broadridge data — is another regulator-friendly regime favoured by both APAC and Indian investors, largely due to the Double Taxation Avoidance Agreement (DTAA) between Mauritius and India, which offered tax advantages. CDSL data indicates that well over half of FPI/FII holdings in Indian mutual funds as of May 2025.
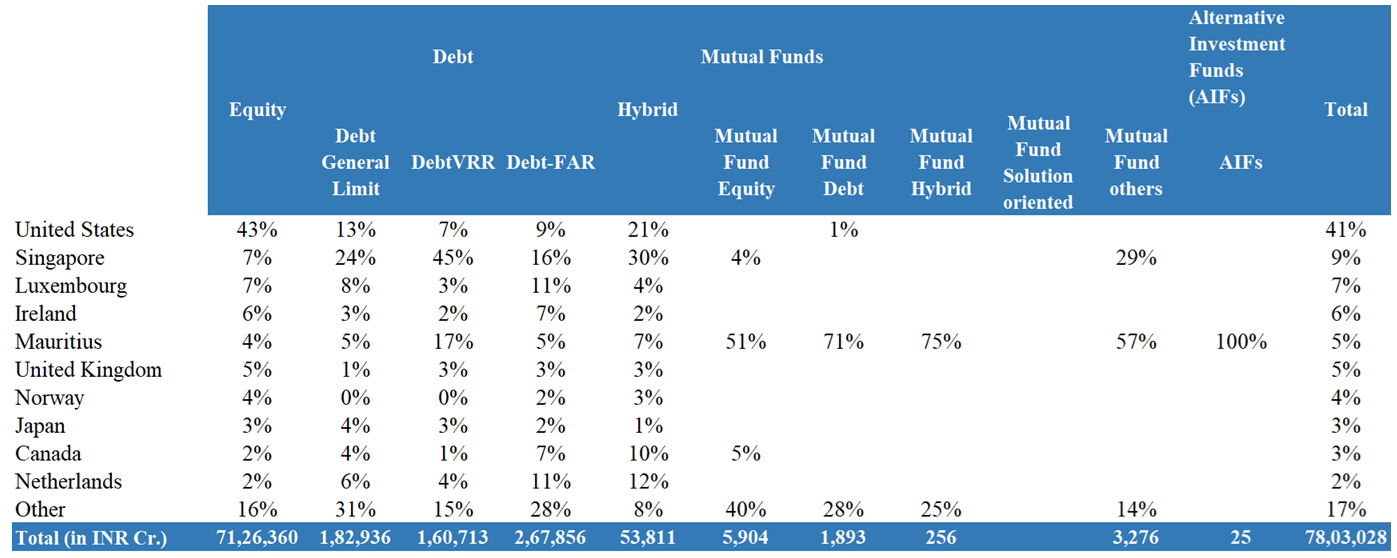
However, given that DTAA was renegotiated in 2016 such that capital gains from the sale of shares acquired through Mauritius-based entities after April 1, 2017, became subject to taxation in India and the introduction of a Limitation of Benefits (LOB) clause to ensure that tax benefits were extended only to genuine residents of Mauritius, FPI/FII activity has been estimated to have largely shifted to Luxembourg and Singapore. Thus, this activity is estimated to largely be the result of holdings initiated before 2017.
Singapore, meanwhile, holds a substantial position in Indian debt: particularly government debt under the uncapped and time-bound “Voluntary Retention Route” (VRR) and uncapped “Fully Accessible Route” (FAR) frameworks. A little under half of all VRR debt and a quarter of general debt (which includes corporate paper) is held by Singapore-registered investors.
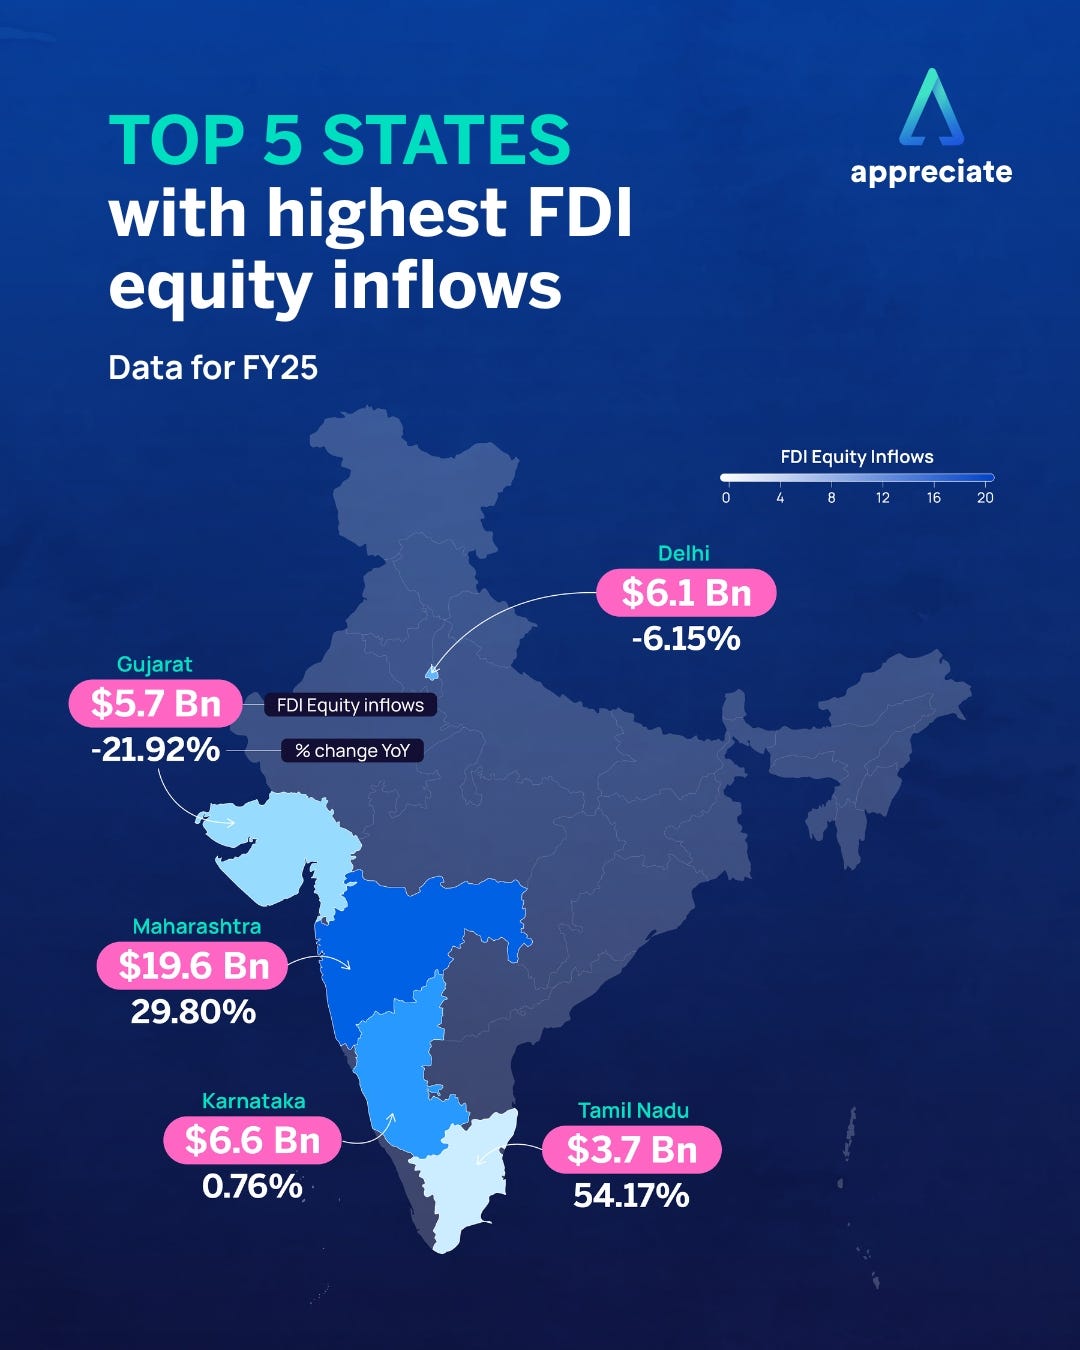
Meanwhile, Foreign Direct Investment — which involves a foreign investor taking control or holding significant stakes in a domestic company or joint venture — continues to grow, with Western and Southern India continuing to command a lion’s share.
As of March 2025, Broadridge data indicates that the U.S., Japan and the United Kingdom in the Top 3 positions of total activity — including tactical trading not included under “AUC” computation. The fourth place was, surprisingly, occupied by Chilean investors. Japanese, U.K. and Chilean-domiciled investors are reportedly acquiring exposure through actively managed funds — which Europe has long been a pioneer in throughout the Western Hemisphere.
In case of Chile and Japan, ongoing work at the “top” has been informing (and leading) investors. Chile and India have worked out a Comprehensive Economic Partnership Agreement in areas such as tech, financial services and critical minerals in May this year, followed by conversations around a free trade agreement. Meanwhile, Japan’s Embassy in New Delhi released a note on the 23rd of June this year, wherein it highlighted that deepening economic ties with India will remain a firm commitment for years to come — from 2000 till the end of 2024, Japanese FDI investments in India sum up to over $43 billion.
In May this year, Bank of America’s (BofA) Asia Fund Managers Survey indicated that India displaced Japan to become the most preferred equity market in Asia — with 42% of fund managers assigning the country with an “overweight” rank.
Does India’s Derivative Clampdown Shore the Market?
In the Substack article published near the end of June 2023, a key fact pattern of India’s equity universe was highlighted: its Price to Earnings (PE) Ratio discipline. For instance, the benchmark NIFTY 50 has mostly remained in the 20-26X range for most of this current century. However — as highlighted in another article from a month prior — the Hindenberg Research vs Adani saga (which is still ongoing) highlighted a worrying notion: in wake of the sense of bullishness that prevails among India’s domestic investors, there is ample room for “gaming” the sentiment for tactical gains. The finger of blame has squarely (and traditionally) been pointed at select U.S.-headquartered players whose actions lie at odds with the more-welcome long-term investors from the rest of the world. In the wake of such suspicions and scandals, Indian regulators have been far more innovative (and audacious) in their mission to stabilize markets for the silent majority.
In overall terms, overall notional turnover in Indian index options have been several orders of magnitude greater than that seen in stock options and total averages.

While nominal index option turnover tumbled in the start of 2024, it went on to recover until November 2024 — wherein a precipitous drop was witnessed. This was largely due to restrictions imposed by Indian regulator SEBI: in a bid to protect the rapidly growing domestic investor class from predations borne by speculative froth, the number of weekly options contracts available to trade for investors was limited to one per exchange and the minimum trading amount was raised nearly three times from ₹ 500,000 ($5,967) to ₹1.5-2 million. In a separate set of instructions, the regulator directed exchanges to increase their risk management measures for equity derivatives and also directed them to increase the collateral for these contracts.
When considering FIIs vs Domestic Institutional Investor (DII) activity, it is clear that index option activity was being driven by retail investor/tactical investor activity: net purchases spiked among both through October and November.

The resilience of domestic investors is evident through global cues that would spook global investors/FIIs: over the past month (June), FIIs were net sellers of stock futures on concerns of the U.S.-Iran showdown escalating and impacting economies in the region. However, domestic investors remained resilient buyers — with FII index option buyers joining in the bullish fray.
Towards the end of May this year, SEBI tightened derivative restrictions further by increasing position limits for index options, the active tracking of open interest, and the tweaking of market-wide position limits (MWPL) for stocks. Slated to be implemented in phases from July through December, the market expects market volatility via speculative activity to reduce and ultimately reward retail investors who have long carried the market for over a quarter-century now.
Reduced volatility in the market of an economy that continues to grow from a ever-strengthening domestic consumption engine would likely make investments in said market more stable, disincentivize market froth, and create a stronger investment case for FIIs seeking vehicles for long-term growth. With trading set to being allowed on non-benchmark indices, there will be some room for growth even among tactical investors — albeit in a more-surveilled environment.
All in all, the market being shaped further strengthens the case for managers of cross-border funds to either increase the proportion of Indian equities being held or further drill down into sectors for better overall performance.
For a list of all articles ever published on Substack, click here.