

Indian Markets: A Quiet Juggernaut
Part 2 of the "Great Delink" Series that highlights the increasing distance between the West and the East


In November 2021, Western markets began to show signs of weakness and drawdowns At this precise moment, The Carlyle Group - easily one of the Top 5/Top 10 Private Equity firms in the world - announced that it was doubling down on its investments in India. X.D. Yang, the firm’s Asia chairman said,
“In India, the investment amount and pace is getting pretty close to that of China now for Carlyle. That has a lot to do with India’s growth, its scale and its opportunities.”
That same month, Morningstar reported that the Indian market drew up early par with Taiwan’s performance in 2020 with one source naming the republic’s continuing push to reformation of the manufacturing landscape and labour laws along with the push towards privatizing state-owned enterprises being a significant factors.
Investing into Indian equities, however, has a few caveats that are quite unlike those discussed with regard to Chinese equities (as discussed in Part 1).
Basic Definition of Limits
For over a quarter of a century, India’s central bank Reserve Bank of India (RBI) and market regulator Securities and Exchange Board of India (SEBI) have assiduously maintained the following limits on participation from overseas investors who are classified as Foreign Institutional Investors (FIIs), Non-Resident Indians (NRIs), and Persons of Indian Origin (PIOs):
Overall investment relative to the “paid-up capital” (i.e. the amount raised by a company via the sale of stocks to the public) cannot exceed 24% for FIIs and 10% for NRIs/PIOs. In some cases, the latter can have their limit extended to 24% if the company doesn’t object.
The RBI begins monitoring investments 2 percentage points below the limits for each category of overseas investors. When this cut-off is reached, no bank branch is allowed to initiate any more purchases.No FII can own more than 20% of any bank’s paid-up capital.
No FII or Mutual Fund (MF) can hold more than 15% or ₹ 500 crores (whichever is higher) in index futures or options.
Furthermore, short positions by both categories cannot exceed their holdings in stocks and long positions cannot exceed their holdings in cash, government securities, Indian T-Bills, etc.In stock futures and options, the regulators specify a delineation point of ₹ 500 crores in market-wide position limit (MWPL) on each stock, with different allowances for FIIs/MFs:
For stocks over this point, the combined futures and options position limit for any FII/MF is 20% of applicable MWPL or ₹ 300 crores, whichever is lower. Total position in futures cannot exceed 10% of ₹ 300 crores, whichever is lower.
For stocks under this point, the combined limit is 20% of MWPL. Total position is the lower of the same limit or ₹ 50 crore.
Note: A “crore” is 10 million; a “lakh” is 100,000
Additional rules apply at the sub-account level, i.e. when a FII/MF has different fund styles running at the same time. Unlike with China, there is no arcane system of share classes.
One interesting facet was that Indian regulators had traditionally not permitted multiple share classes in order to prevent exploitation of minority shareholders. This was followed by a series of complicated maneuvers to adopt the multi-class system seen in Western markets.
The issuance of “Differential Voting Rights” (DVR) shares, first ratified in 2000, had a rather interesting quid pro quo effect on share structuring. For example, two Indian companies - Tata Motors and Pantaloons Retail (now renamed as Future Enterprises Limited) - issued DVRs with 1/10th the voting rights relative to ordinary shares in exchange for a 5% higher dividend. After a case that involved one shareholder in a listed company who - as alleged by minority shareholders - gained disproportionate control over a company via DVRs was dismissed by the Corporate Law Tribunal, the regulator made a rather principled stand in 2009:
“…the company agrees that it shall not issue shares in any manner which may confer on any person, superior rights as to voting or dividends vis-à-vis the rights on equity shares that are already listed.”
This resulted in Indian companies interested in issuing DVRs doing so by issuing “bonus shares” with lower voting rights but carrying the same dividend rights as ordinary shares. There were also substantial provisions such as ordinary shares being issued before DVRs and instructions specific to promoters (i.e. founders, et al) holding shares with superior voting rights, among other matters. All in all, this structure became rather cumbersome for established companies and often put them at odds with the Indian investor network.
All of this changed after increasing overall interest - both overseas and domestic - in Indian companies over the last few years. In November of last year, after extensive discussion via a “consultation paper” - a mechanism used by authorities to promote discussion from investors and companies and modify frameworks - new regulations now ease the provisions thus:
DVRs can now constitute 74% of total voting power.
Superior Voting Right (SVR) shares - not exceeding ten votes per equity share - may be issued while fractional voting rights can be as low as one vote for 10 DVR shares.
DVR shares would trade like ordinary shares but at a discount, would not be eligible to receive “bonus shares” and may not be issued regularly.
“Sunset clause” mechanisms have been designed to convert DVRs and SVRs into ordinary shares after a period of five years, which can be extended by another five years.
Western market aficionados wondering why regulators focus so keenly on ensuring long-term investor parity is due to high levels of corporate governance in India to ensure fairness. As the asset allocation matrix exemplifies, the primary goal of market activity is to ensure Indian investors end up with profits for their economic contributions.
Market Effects
A common refrain heard among novice investors into Indian equities (which - sometimes - even seasoned global market professionals echo) is that the Indian market has a high correlation with Western markets, particularly the U.S. Another reason attributed for this is high FII activity in active trading.
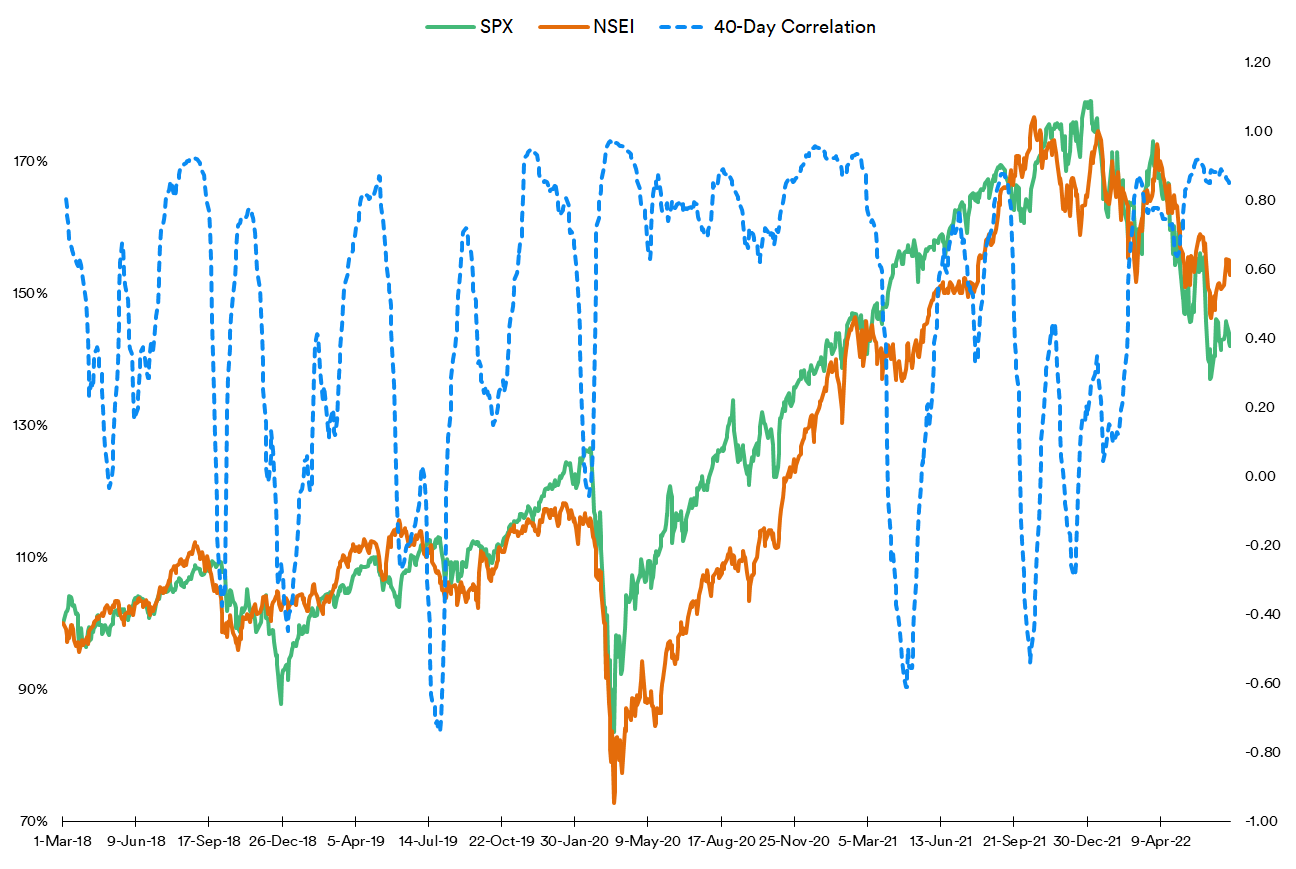
Lets consider the first argument: namely, that the Indian market is correlated with that of the U.S. For this, three U.S. indexes are compared against three Indian indices:
The S&P 500 (SPX) vs the NIFTY 50 to represent the “Large Cap”
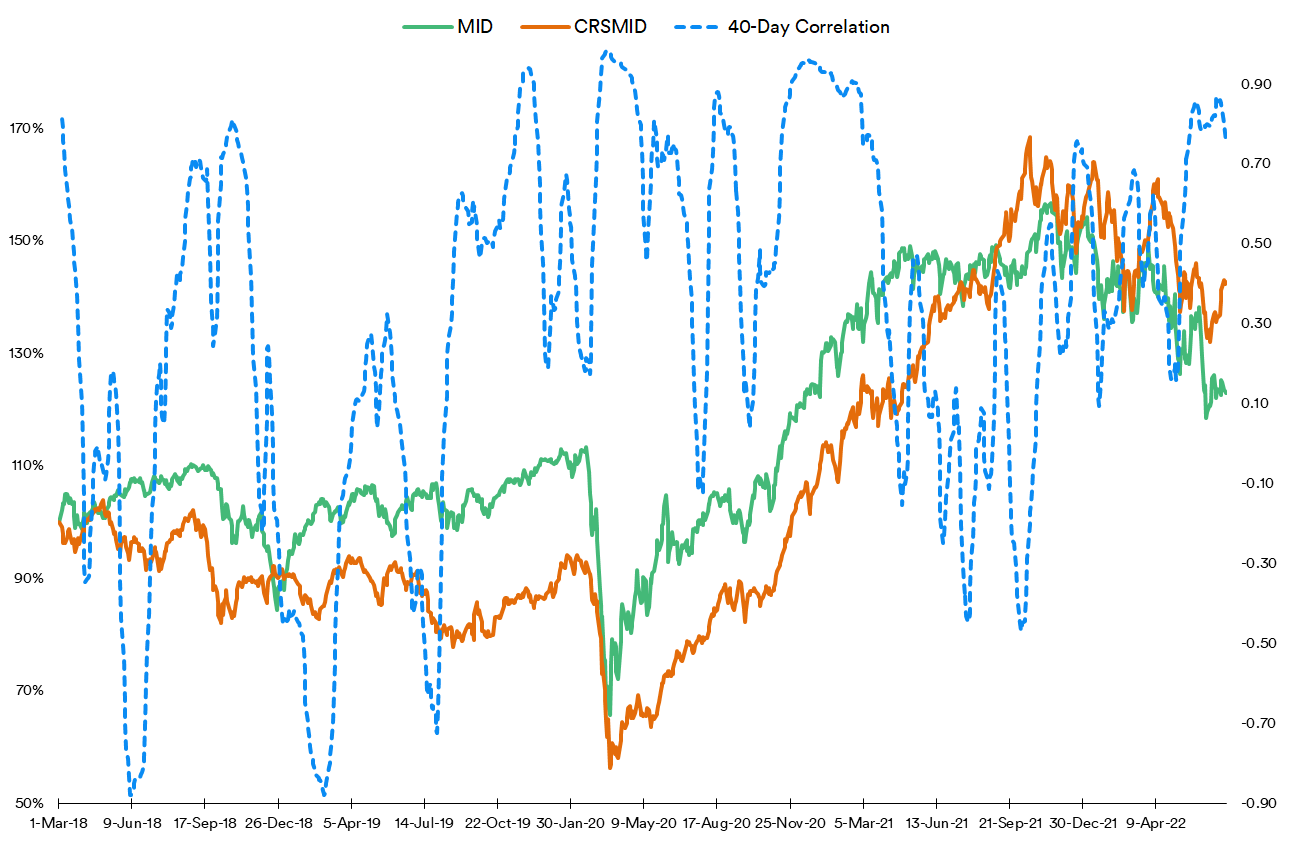
The S&P MidCap 400 (MID) vs the NIFTY Midcap 100 (CRSMID)
The S&P SmallCap 600 (SPCY) vs the NIFTY SmallCap 100 (NIFSMCP100)
On a calendar year basis, the correlations in each “cap” category are:

Going from low correlations in 2018 till the rather high correlations in the Year Till Date (YTD), an argument could be made that the growing convergence indicates increasing FII activity. For instance, the drop in 2021 could be explained away with ballooning overvaluations in U.S. markets - the most overvalued market in the world - attracting high interest.
This argument, however, falls apart when considering 40-day correlations (roughly two months’ worth of trading days) between the U.S. and Indian indexes.
In the large caps, high correlations are certainly prevalent more often than not. This could support the argument that there is high FII interest in the republic’s 50 most valuable companies, which is historically true.
In the midcaps, this correlation is less high and less persistent in comparison to large caps:
In the small caps, its far less persistent and generally less high than in the midcaps:

In the YTD, an argument could be made that the increasing correlations - on both 40-day trailing and calendar year basis - is indicative of increasing FII activity.
The directionality of this trading activity reveals a very telling tale. In most other markets, delineating the two cannot be objectively made. In India, SEBI clearly delineates flows between FIIs and their domestic counterparts (DIIs). The story told here is very interesting. For that, some “quantification terms” need to defined.
A “Common Buy-In” is when the both categories are net purchasers in the market. The inverse is termed a “Common Selloff”
A “Buy-In” when only one category is a net purchaser. This automatically implies that the other category is in “Selloff”
A “Gap” is defined as the percentage difference during a “Buy-In”. Example: if FIIs “buy in” ₹100 while DIIs “sell off” ₹80, the gap is +25% for FIIs. If the former “buy in” ₹80 while DIIs “sell off” ₹100, the gap is -20% for FIIs.
With these terms in mind, what’s evident is that DIIs have been buying in since April of last year:

Over the past ten years - divided into two 5-year “buckets” - it can be seen that FII “Buy Ins” outpaced those by DIIs more often than the other way around in the earlier bucket:

In the more recent bucket, DIIs have been buying in, albeit with a negative gap, i.e. bullish and conservative.
Neither category could be considered a collection of “unsophisticated investors” - a term which, arguably, could be (and often is) applied to retail investors. Both categories have sophisticated models, well-researched outlook, experienced traders, etc. Unlike in China (as shown in the previous article), the government doesn’t operate a “national team” to prop up valuations.
One reason for the difference in behaviour could be the long-term outlook, with FIIs being bearish and DIIs being bullish. The latter have a lot of consensus in their favour even from their overseas counterparts.
Economic Outlook
In its commentary shortly at the dawn of the new year, British financial information provider IHS Markit - now a part of S&P Global - laid out a number of factors in the framing of its outlook. The primary factors was the country’s Purchasing Managers’ Indexes - surveys made of private companies. A reading over 50 indicates growth while a value below that suggests contraction. India’s manufacturing PMI averaged 52.08 from 2012 until 2022, reaching an all-time high of 58.90 in October of 2020. Services PMI increased to 59.2 in June 2022 from 58.9 in May, pointing to the strongest expansion in the sector since April 2011. Added to this was strong GDP growth from the second quarter of last year onwards and ever-increasing Foreign Direct Investment, i.e. controlling interests in (predominantly) new enterprises/subsidiaries being established via cross-border investments.

IHS thus predicted that India’s economy would be the 2nd largest economy in Asia by the end of this current decade, with its nominal GDP surpassing both Japan and UK:

In late 2019, British bank Standard Chartered posited that India’s economy would be the 2nd largest in the world in Purchasing Power Parity (PPP)-adjusted terms within the same period:
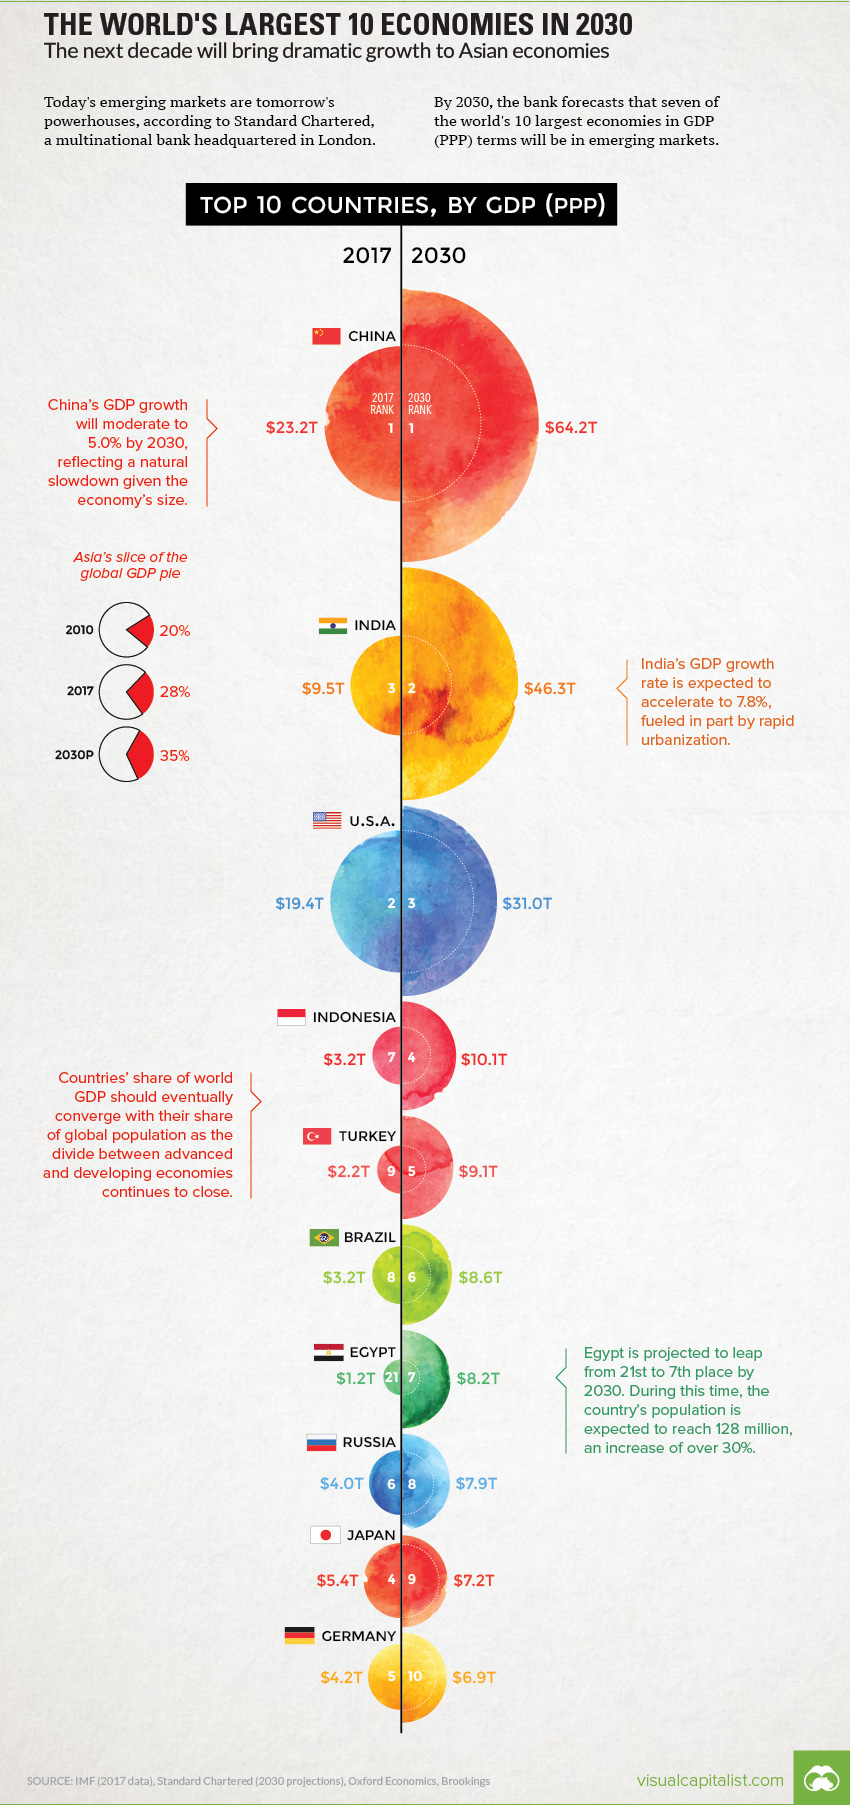
While the PPP-adjusted outlook does tend to change over time, this representative set should make it clear that there is no substantial consensus differences in long-term outlook.
So what explains the FII activity? Evidence suggests it’s investment behaviour. More on that in Part 3.