


Macro and Market Trends: India vs China
As of Q1 2024, there's really no macroeconomic or market-driven argument for the "Sell India, Buy China" asset management model.

“Buy India, Sell China” (or the converse) is reportedly a well-established playbook among many an instituitional investor. However, market trends that are tied to macroeconomic changes have rendered this paradigm moot for many years now. Perhaps it’s time fund managers took a deeper look beyond learned tropes. Read on!
Update: Elements of the summary on Indian SOE stocks (section 2 of this article) were proffered as opinion and subsequently quoted in a Bloomberg article. Click here to read the article.
At the dawn of 2014, market capitalization at the National Stock Exchange (NSE) of India was a little over one-fifth of the combined market capitalization of all constituents within China’s byzantine share classes. 2014 onwards, India’s market capitalization gradually went on an sustained — and then explosive - growth.
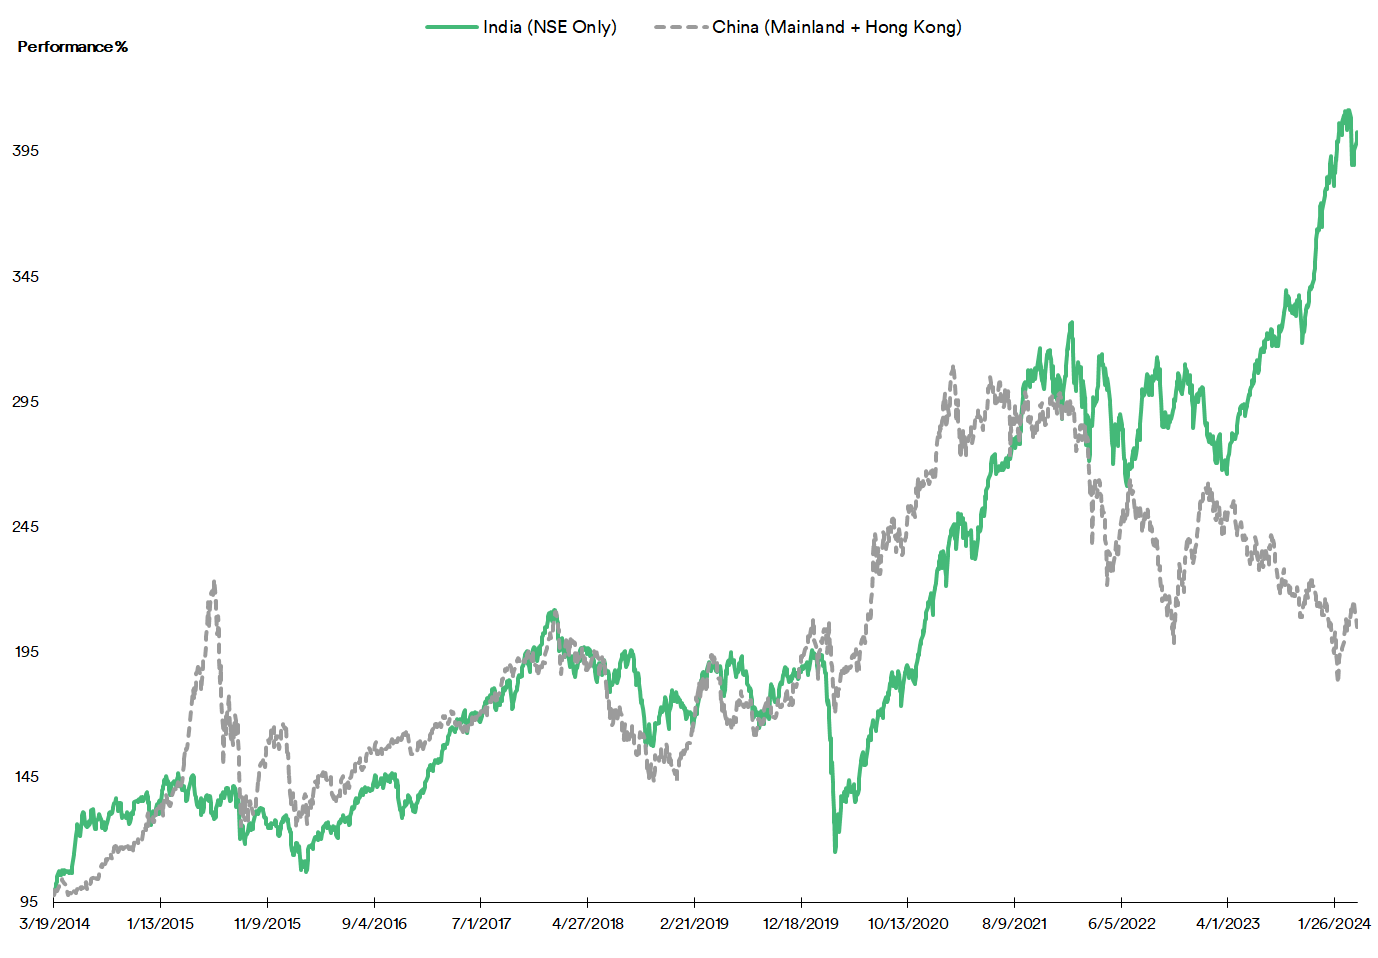
10 years later, NSE’s market capitalization is a third of all of China’s, with an explosive climbing trend that started in 2020 staying firmly resilient, despite the occasional periods of uncertainty.
This trajectory is also reflected in the FTSE India All-Cap and MSCI China All-Share indices, which cover all the large- and mid-cap stocks of India, China and Hong Kong.

The Indian index has seen Price to Earnings (PE) and Price to Sales (PS) Ratios go up by more than a third and around half of their 2014 values respectively while the Chinese index’s ratios is reduced by a fifth and third respectively.

The relatively diminutive Hang Seng, by virtue of being accessible to overseas investors to shore up valuation, has seen the corresponding ratios improve by 5% and decrease by 9% respectively. All in all, it’s a massive fall for the index from its giddying pile-on through 2020.
Regardless of share class, the Chinese economy has three interrelated engines: export revenues, domestic consumption and infrastructure (of which real estate is a massive component). With real estate valuation in tatters in all but 3-4 major cities and domestic consumption growth becoming increasingly tentative, the engines are beginning to misfire in a vicious cycle. The dysfunction in the Hang Seng valuation is largely due to qualified overseas investors seeking to maintain a China exposure while "domestic" share classes are trending bearish. This dysfunction will eventually have to be corrected.
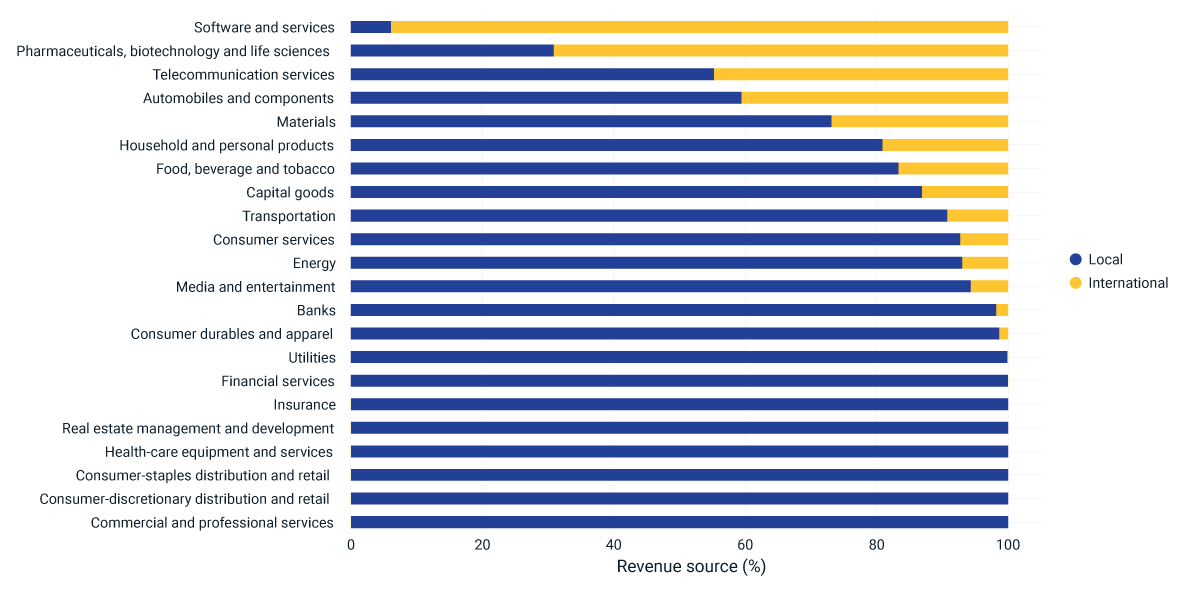
In contrast, the Indian economic engine is simply its own citizens’ consumption, which have trended upwards for the better part of a decade. An additional factor that aids the engine is a historically strong consumer preference (and steadily increasing government incentives) for domestic consumption.
In more ways than one, India’s “Aatmanirbhar” (self-reliance) doctrine and “Make In India” production incentives are delivering progressively stronger results. By the end of Q1 2024, India’s March manufacturing PMI rose to its highest level since 2008. Manufacturing companies expanded hiring in response to strong production and new orders. Production and sales have risen at the fastest rates since October 2020 with near-record increase in input stocks.

Over on the markets front, the Hang Seng can be expected to seek greater correlation with domestic-only stocks (i.e. A- and B-Shares), wherein PE Ratios will likely continue to rationalize by a third to half of its present values, given that earnings and revenues are bound to slip in growth. A slight rally might be attempted in Q3 which will raise weighted-average levels by 10-15%, following which there will be a meander through the end of 2024.
In contrast, the Indian indices will have much to cheer and it’s largely by dint of its homeland’s energies and favour, be it in consumption or in stock valuation.
The Resilience of State-Owned Enterprises
Most of India’s SOEs (also known as “Public Sector Units” or “PSUs”) owe their conception to a specific purpose by the government, barring the likes of the state-owned banks: most of these (except for the State Bank of India) were nationalized ostensibly to reform banking practices and promote credit inclusion.
The “specific purposes” frequently tend to be highly strategic. For instance: IREL India was established in 1950 to ensure an adequate supply of rare earth elements are available to the nation, Pawan Hans was established in 1985 to provide airborne connectivity to otherwise-inaccessible locations, and so forth. In most cases, SOEs were pioneers breaking ground at a time when the market was underdeveloped and thus a risky point of entry for private players.
Unlike in India, virtually every major enterprise in China tended to be state-owned and -operated until economic liberalization birthed a deluge of private companies. Both India’s and China’s SOEs occupy somewhere around 40-50% of total market capitalization.
Typically, SOEs are perceived to have accrued a significant amount of bureaucratic inertia, workforce bloat and operational inefficiency. Furthermore, they tend to follow government directives for new endeavours that often turn out to be costly and unprofitable. In August last year, India’s Prime Narendra Modi urged citizen investors to invest in Indian PSU stocks and shake off the idea that these are a lost cause. There is an inherent logic to this: while there may be a degree of inertia, bloat and inefficiency, PSUs tend to have a massive amount of market reach owing to their First Mover Advantage giving them a strong foothold in the broad market. “Strategic” PSUs also can count on government bodies for payments — an assured supply of revenue. Through gradual governance reform over the greater part of the past decade, Indian SOEs have brought about steady improvements in operational efficiency as well as in financial standing via aggressive debt burden reduction measures. With ongoing divestiture from non-core businesses restructuring organizational focus, they're increasingly better placed towards achieving value maximization.
Less than six months after the Prime Minister’s exhortations to buy PSU stocks, PSU stocks registered a Year-on-Year (YoY) net profit growth of 15% for the quarter ending in December, with some registering over 100%. Not a single constituent of the 56-member BSE PSU index delivered negative returns in YoY terms.
One strong revenue driver has been increased spending on infrastructure and military modernization, which positively impacts a number of relevant SOEs in related sectors, with greater profit potential unlocked via improved efficiency and with First Mover Advantage already in place with full-scale production facilities already at hand.
In comparison to their Chinese peers, 2021 was a flagship year for Indian SOEs:

While Indian SOEs significantly underperformed relative to Chinese SOEs through 2019 and 2020, the former had a massive breakout year in 2021 with a 300% outperformance. The next two years saw Chinese SOEs shrink in capitalization while Indian SOEs moved from strength to strength.
While new government guidelines over bond issuance for state-owned firms to improve the efficiency of approval process and strengthen supervision control to prevent default risks did help propel some top-of-the-line Chinese SOE stocks to the leaderboard position for a period of time, Chinese markets were lackluster in 2023, as consumer spending tightened in the face of economic headwinds nearly 20 years in the making. While much ado was made in 2023 as to how state-mandated “reconsideration” of valuation methods to include how SOEs have a positive contribution to society and the overall economy will now direct investment flows, this found little sustained purchase even among domestic investors.
However, SOEs tend to be deemed more survivable and do offer a resilient chunk of exposure to the economy if the private sector shows signs of faltering. Increased overseas investor interest in risk-offs to maintain exposure within China is one factor behind the Hang Seng China Central SOEs Index (HSCSOE) — a 50-member collection of mostly H-Shares and “Red Chips” of SOEs — have done marginally better than the domestic-only CSI indices in the YTD.

Of course, the BSE PSU Index has been outperforming all three Chinese indices for over three years now. Over in India, despite PSUs’ strong showing, the clear champion was the MidCap sector, which is beginning to find greater favour among Foreign Portfolio Investors (FPIs).

Most PSUs, barring a few notable exceptions, are in the mid-cap by market capitalization and revenues. However, their weighted-average PE and PS Ratios are running at a third of the valuation seen in the MidCap 100 — which itself is running hot over the past three quarters — and roughly half that seen in the traditional FPI favourite NIFTY 50.

In the YTD, Indian SOEs outperform Chinese SOEs 7:1 on average. While most Indian SOEs tend to be "mid-cap" level (with a few very notable exceptions), they're trading at price ratios that are half of the large-cap NIFTY 50 and a third of the NIFTY Midcap 100. By Q4 2024, a greater convergence of PSUs’ weighted-average ratios can be expected to reach close to that of the NIFTY 50 at least while that of MidCaps can be expected to have a soft pullback by about 15%. Traditionally, ratio discipline has been a key factor in Indian stock valuations. This discipline, however, has seen some bullish expansion in allowances due to strong earnings growth.
All in all, the idea that Chinese and Indian assets are each others’ inverse in terms of investment potential is a hoary chestnut. It could be argued that this was true for a period of time in the nineties as market liberalization spread across Asia after the collapse of the Soviet Union. However, the author has it on good authority that the nineties ended a couple of decades now. Both countries (and their respective industries) have vastly differing priorities and objectives now.
A “New India” themed series of articles published last year highlight other advances within the Indian economy. Click here to read more about trends that pointed to “New India’s” decade. Next, click here for a full overview on India’s race to make a jet engine. Click here to to read about India’s work in the AI race that could propel the country into the Top 3 podium soon. Finally, click here to read more about a quiet fintech revolution in motion.
The “Dharma” series — which traces the evolution of Eastern faith and philosophy — also features India in great detail. Here’s Part 1, Part 2, Part 3, Part 4 and Part 5, followed by the ancillary Part 6 and Part 7 discussing Malaysia’s and Indonesia’s spiritual history.
For a list of all articles ever published, click here.
Great Article , many thanks!